-
Welcome to MacanEVowners! If you're joining us from Taycanforum.com, then you may already have an account here.
If you were registered on Taycanforum as of January 24, 2024 or earlier, then you can simply login here with the same username and password
If you wish, you can remove your account here.
Sponsored
Real consumption / range / efficiency thread … post your Macan EV performance 📊
- Joined
- Nov 24, 2024
- Threads
- 1
- Messages
- 13
- Reaction score
- 2
- Location
- Ontario, Canada
- Vehicles
- Macan EV Turbo
I am taking my Macan EV Turbo on a road trip next week from Toronto to Boston. Are there any charging networks to avoid ? Has anyone tried the Tesla charger with the building in adapter?
- Joined
- Oct 30, 2024
- Threads
- 0
- Messages
- 21
- Reaction score
- 23
- Location
- United Kingdom
- Vehicles
- 2024 Macan 4
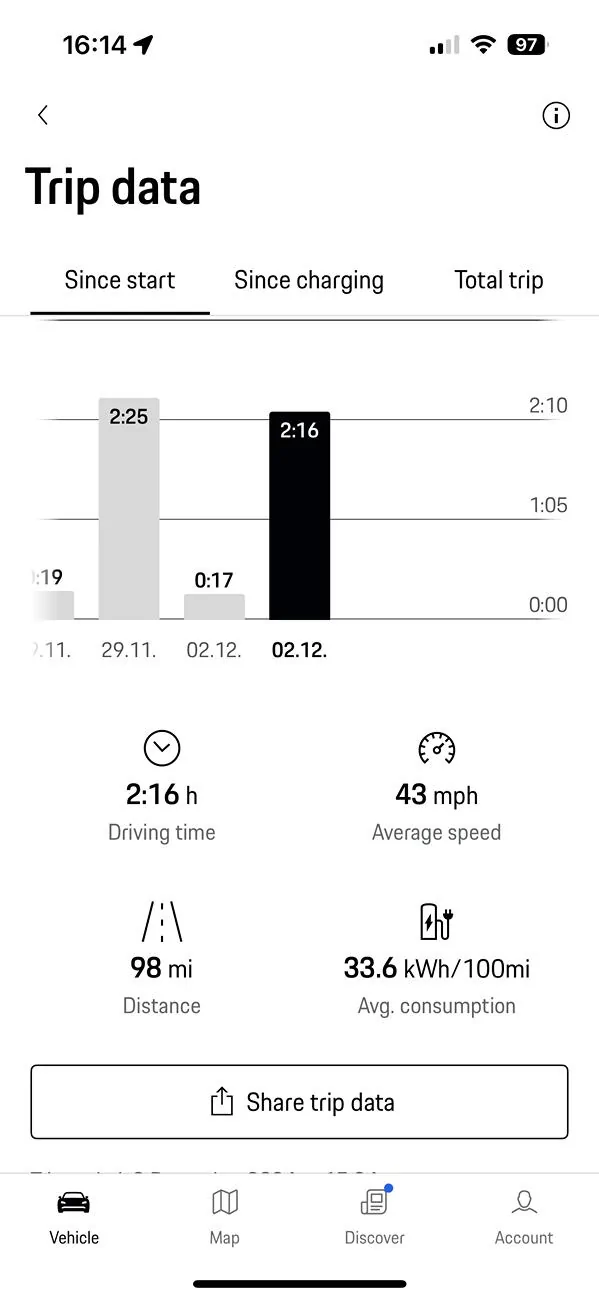
Latest trip a bit better. Slightly less dual carriageway miles. Average 9.5 degrees C

- First Name
- John
- Joined
- Jan 11, 2024
- Threads
- 85
- Messages
- 924
- Reaction score
- 1,044
- Location
- Pacific Northwest U.S.
- Vehicles
- Macan EV Turbo & C8 Z06
I enjoyed your using the word “carriage way” (not being sarcastic) Picturing 100 years ago with actual carriages. Here in the U.S. that is a word only used in a UK movie. Thanks. I enjoyed reading it.
- Joined
- Oct 30, 2024
- Threads
- 0
- Messages
- 21
- Reaction score
- 23
- Location
- United Kingdom
- Vehicles
- 2024 Macan 4
We still refer to them as a Dual Carriageway and a single carriageway ?. But then we do have Motorways too!I enjoyed your using the word “carriage way” (not being sarcastic) Picturing 100 years ago with actual carriages. Here in the U.S. that is a word only used in a UK movie. Thanks. I enjoyed reading it.
- Joined
- Sep 9, 2024
- Threads
- 13
- Messages
- 702
- Reaction score
- 527
- Location
- London, UK
- Vehicles
- Previous BMW i4 eDrive 40, now Porsche Macan Base EV
Yes, but we don't have highways 
- First Name
- Bill
- Joined
- Apr 6, 2020
- Threads
- 1
- Messages
- 129
- Reaction score
- 152
- Location
- Oregon
- Vehicles
- 2024 Macan Turbo Electric, 2020 Taycan TS, 2012 Cayman SBE 987.18
Too our surprise, our 2024 Macan Turbo PCM led us to a Tesla Supercharger with Magic Docks in Indiana - our first Tesla experience. Local Maintenance guy showed me how to press and hold the button on the Tesla plug for 2 seconds to remove it with the Magic Dock adapter attached.I am taking my Macan EV Turbo on a road trip next week from Toronto to Boston. Are there any charging networks to avoid ? Has anyone tried the Tesla charger with the building in adapter?
Had to download and create a Tesla account on my iPhone, but no Macan exists (two weeks ago) on the application. Gambled that a 2024 Taycan selection might be close enough. It worked beautifully! Charge was nearly 250 kW and cost was half what I was expecting (it was a truck stop).
- First Name
- Gert
- Joined
- Oct 20, 2024
- Threads
- 2
- Messages
- 44
- Reaction score
- 80
- Location
- Dubai, UAE
- Vehicles
- Macan EV Turbo ‘24 - Cayenne GTS ‘23 - 911 992.1 Carrera S ‘20
So, I had too much time on my hands and I decided to to some "structured testing" on this. I already had collated data from a few road trips where I could drive uninterrupted on flat area (there is always a minimal amount of up and down) on highways for 10's of kilometers at 140km/h and 160km/h. I now did the same on a 15km straight B-road with max speed 120km/h - I tested at 80, 100 and 120km/h.
Method: cruise control on, same start and finish point at constant speed without any acceleration or braking (so no regen), reset the "trip since" data both in the outgoing and returning leg and average both.
Car: Macan EV Turbo, 22" Exclusive Design Wheels, Offroad package
Environmental parameters: Sunset, 24degC, no wind
Below are the graphs in metric and imperial system:


I also created the below graph, using the 288mi (463km) EPA rated range for a Turbo as 100-0% run (so 95kWh consumption) and calling that 100% efficiency. The graph plots the efficiency compared to EPA range at various speeds:

I know this driving style is artificial as I noticed that the moment you touch your brake and regen efficiency goes up dramatically. It's only aimed to try to measure the impact of speed on range.
Method: cruise control on, same start and finish point at constant speed without any acceleration or braking (so no regen), reset the "trip since" data both in the outgoing and returning leg and average both.
Car: Macan EV Turbo, 22" Exclusive Design Wheels, Offroad package
Environmental parameters: Sunset, 24degC, no wind
Below are the graphs in metric and imperial system:
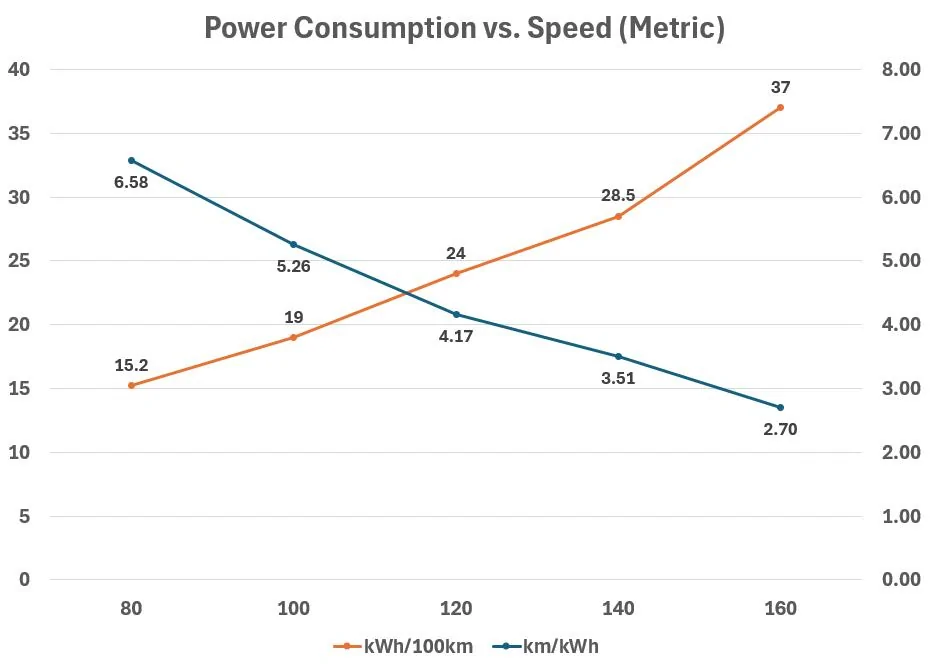
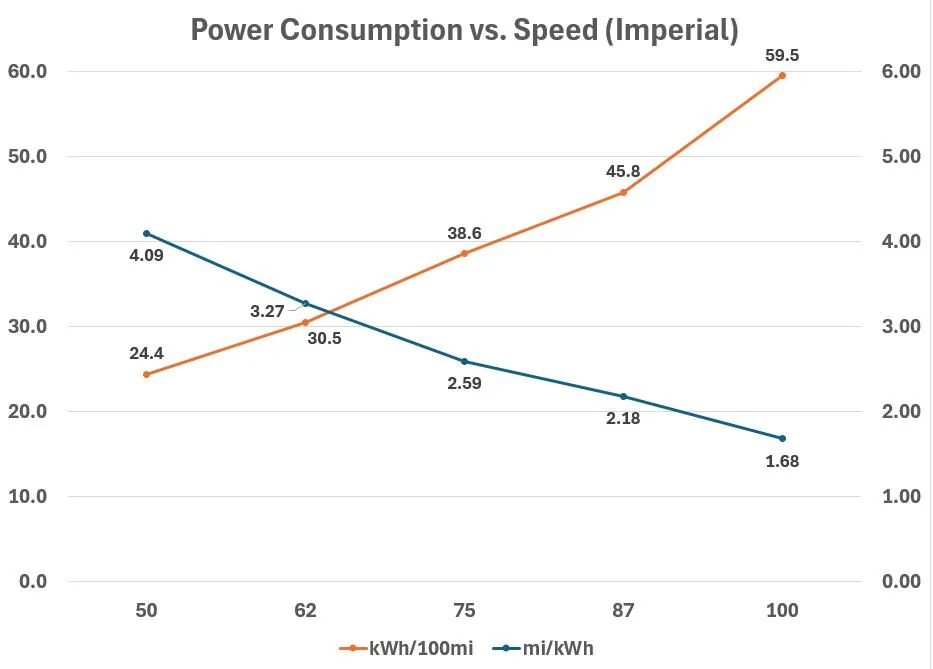
I also created the below graph, using the 288mi (463km) EPA rated range for a Turbo as 100-0% run (so 95kWh consumption) and calling that 100% efficiency. The graph plots the efficiency compared to EPA range at various speeds:
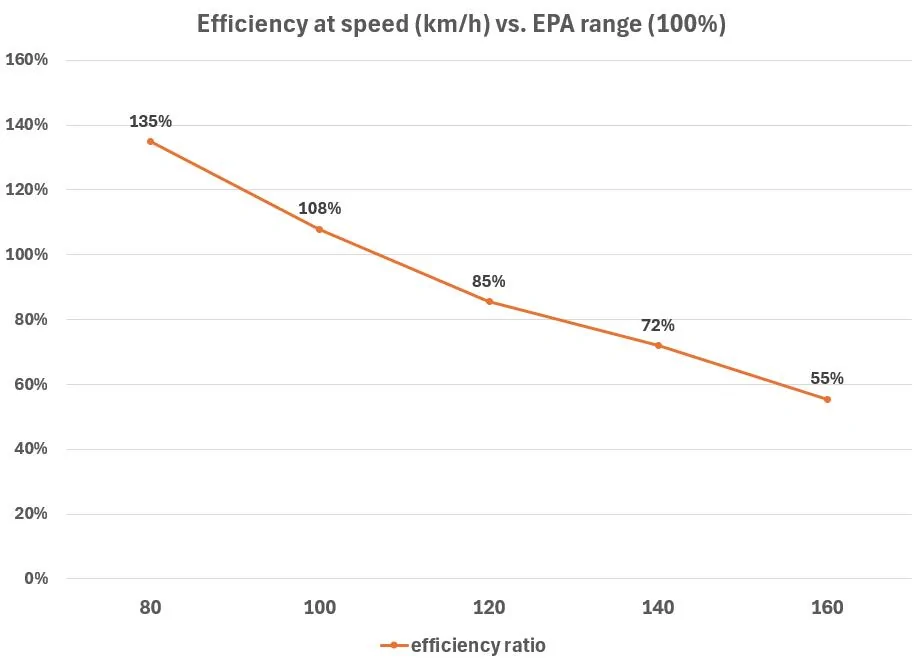
I know this driving style is artificial as I noticed that the moment you touch your brake and regen efficiency goes up dramatically. It's only aimed to try to measure the impact of speed on range.
- First Name
- David
- Joined
- Nov 17, 2024
- Threads
- 12
- Messages
- 308
- Reaction score
- 354
- Location
- New Hampshire
- Vehicles
- 2024 Macan 4 (Volvo XC60 PHEV, Subaru Forester ICE)
This is great: thank you! This is really useful info.
It's really interesting how steep that slope is. It would be fascinating to see how different wheels affect the slope.
Edit: also interesting that plot is that close to a straight line; if the issue is wind resistance alone, I would expect the slope to increase more as speed increases (i.e. square of speed). Perhaps too few data points to really show that?
Last edited:
- First Name
- Gert
- Joined
- Oct 20, 2024
- Threads
- 2
- Messages
- 44
- Reaction score
- 80
- Location
- Dubai, UAE
- Vehicles
- Macan EV Turbo ‘24 - Cayenne GTS ‘23 - 911 992.1 Carrera S ‘20
I will revalidate the 140km/h data again tomorrow (it is on a different road, but over longer distance (about 40km one way). I assume at lower speeds resistance of the wheels on the asphalt is dominant while at higher speeds wind will become dominant?This is great: thank you! This is really useful info.
It's really interesting how steep that slope is. It would be fascinating to see how different wheels affect the slope.
Edit: also interesting that plot is that close to a straight line; if the issue is wind resistance alone, I would expect the slope to increase more as speed increases (i.e. square of speed). Perhaps too few data points to really show that?
- First Name
- Gert
- Joined
- Oct 20, 2024
- Threads
- 2
- Messages
- 44
- Reaction score
- 80
- Location
- Dubai, UAE
- Vehicles
- Macan EV Turbo ‘24 - Cayenne GTS ‘23 - 911 992.1 Carrera S ‘20
I did check just now at 140km/h and the numbers seem correct. So it seems the curve is quite linear between 100-140km/h, with tailing off below that and going exponential at higher speeds.I will revalidate the 140km/h data again tomorrow (it is on a different road, but over longer distance (about 40km one way). I assume at lower speeds resistance of the wheels on the asphalt is dominant while at higher speeds wind will become dominant?
- First Name
- Yves
- Joined
- Jan 28, 2024
- Threads
- 25
- Messages
- 678
- Reaction score
- 504
- Location
- Belgium
- Vehicles
- BMW iX / Macan Turbo
- Thread starter
- #193
Thanks a for this testing quite interesting and conditions, was very interested in the result at “summer” temps. Quite highish at 120 and above …I did check just now at 140km/h and the numbers seem correct. So it seems the curve is quite linear between 100-140km/h, with tailing off below that and going exponential at higher speeds.
- First Name
- Nick
- Joined
- Oct 14, 2024
- Threads
- 17
- Messages
- 262
- Reaction score
- 215
- Location
- Greece
- Vehicles
- Late MY2025 Macan 4S,Ford Kuga 2.5T (Stage 1 tuned @240PS)
I wonder how similar the result would be during a more real life highway driving scenario in regards to average speed ?. During my 2.000Km trip couple of weeks ago from home base to southern Germany (which BTW was mostly on flat surface and straight to extensively straight highways) I couldn't achieve an average speed more than 113Km/h even though there was many times I was travelling at 140-160 for quite long time along the way.Highway traffic,toll stops, border crossings and refueling stops seemingly have a major impact on whole trip average speed which obviously it's way much harder to increase yet so easy to decrease.
So I wonder,this 113Km/h average calculated speed I was traveling with, will impact my consumption the same (more or less or even exactly) like if I was (hypothetically) driving at the same constant speed for the same amount of time?Without any regen, off course in case of EV driving, for things being equal.
Because if this is the case,then I'll get almost the same range with my 4S (on 20' wheels) as I have now that is approximately 475-500Km to empty burning 11,5-12lt/100Km on a 55lt tank.The temps, being such a contributing factor to EV consumption,were ranging from 17 down to 5-7 Celsius all along the way.
- First Name
- Gert
- Joined
- Oct 20, 2024
- Threads
- 2
- Messages
- 44
- Reaction score
- 80
- Location
- Dubai, UAE
- Vehicles
- Macan EV Turbo ‘24 - Cayenne GTS ‘23 - 911 992.1 Carrera S ‘20
I am commuting 75km one way each day. I will take the other highway home today (which is much more busy) - max speed 140km/h but there will be frequent braking and acceleration (usually between 120-140km/h) as per the traffic flow. I am sure consumption will be lower as regen is quite effective from my experience over the last 3 weeks. Will share update tonight.I wonder how similar the result would be during a more real life highway driving scenario in regards to average speed ?. During my 2.000Km trip couple of weeks ago from home base to southern Germany (which BTW was mostly on flat surface and straight to extensively straight highways) I couldn't achieve an average speed more than 113Km/h even though there was many times I was travelling at 140-160 for quite long time along the way.Highway traffic,toll stops, border crossings and refueling stops seemingly have a major impact on whole trip average speed which obviously it's way much harder to increase yet so easy to decrease.
So I wonder,this 113Km/h average calculated speed I was traveling with, will impact my consumption the same (more or less or even exactly) like if I was (hypothetically) driving at the same constant speed for the same amount of time?Without any regen, off course in case of EV driving, for things being equal.
Because if this is the case,then I'll get almost the same range with my 4S (on 20' wheels) as I have now that is approximately 475-500Km to empty burning 11,5-12lt/100Km on a 55lt tank.The temps, being such a contributing factor to EV consumption,were ranging from 17 down to 5-7 Celsius all along the way.
Sponsored

